Master data handling for Class 5 with this worksheet - scaled pictographs, tally charts, and tables. Includes practice questions to help your child organise, interpret, and compare data accurately.
Data means information or facts that we collect about the world. Data Handling is about organising this information so it is easy to read, compare, and use to answer questions. In Class 5, we move beyond simple counting. We now work with scaled pictographs where one symbol can represent more than one item, and we begin drawing conclusions from the data we read.
Tally Marks: Still useful for recording data as we collect it. Four vertical lines crossed by a diagonal line make a group of 5.
Scaled Pictographs: One symbol now stands for a fixed number of items. For example, one apple symbol might equal 2 apples. Always read the key before interpreting the pictograph.
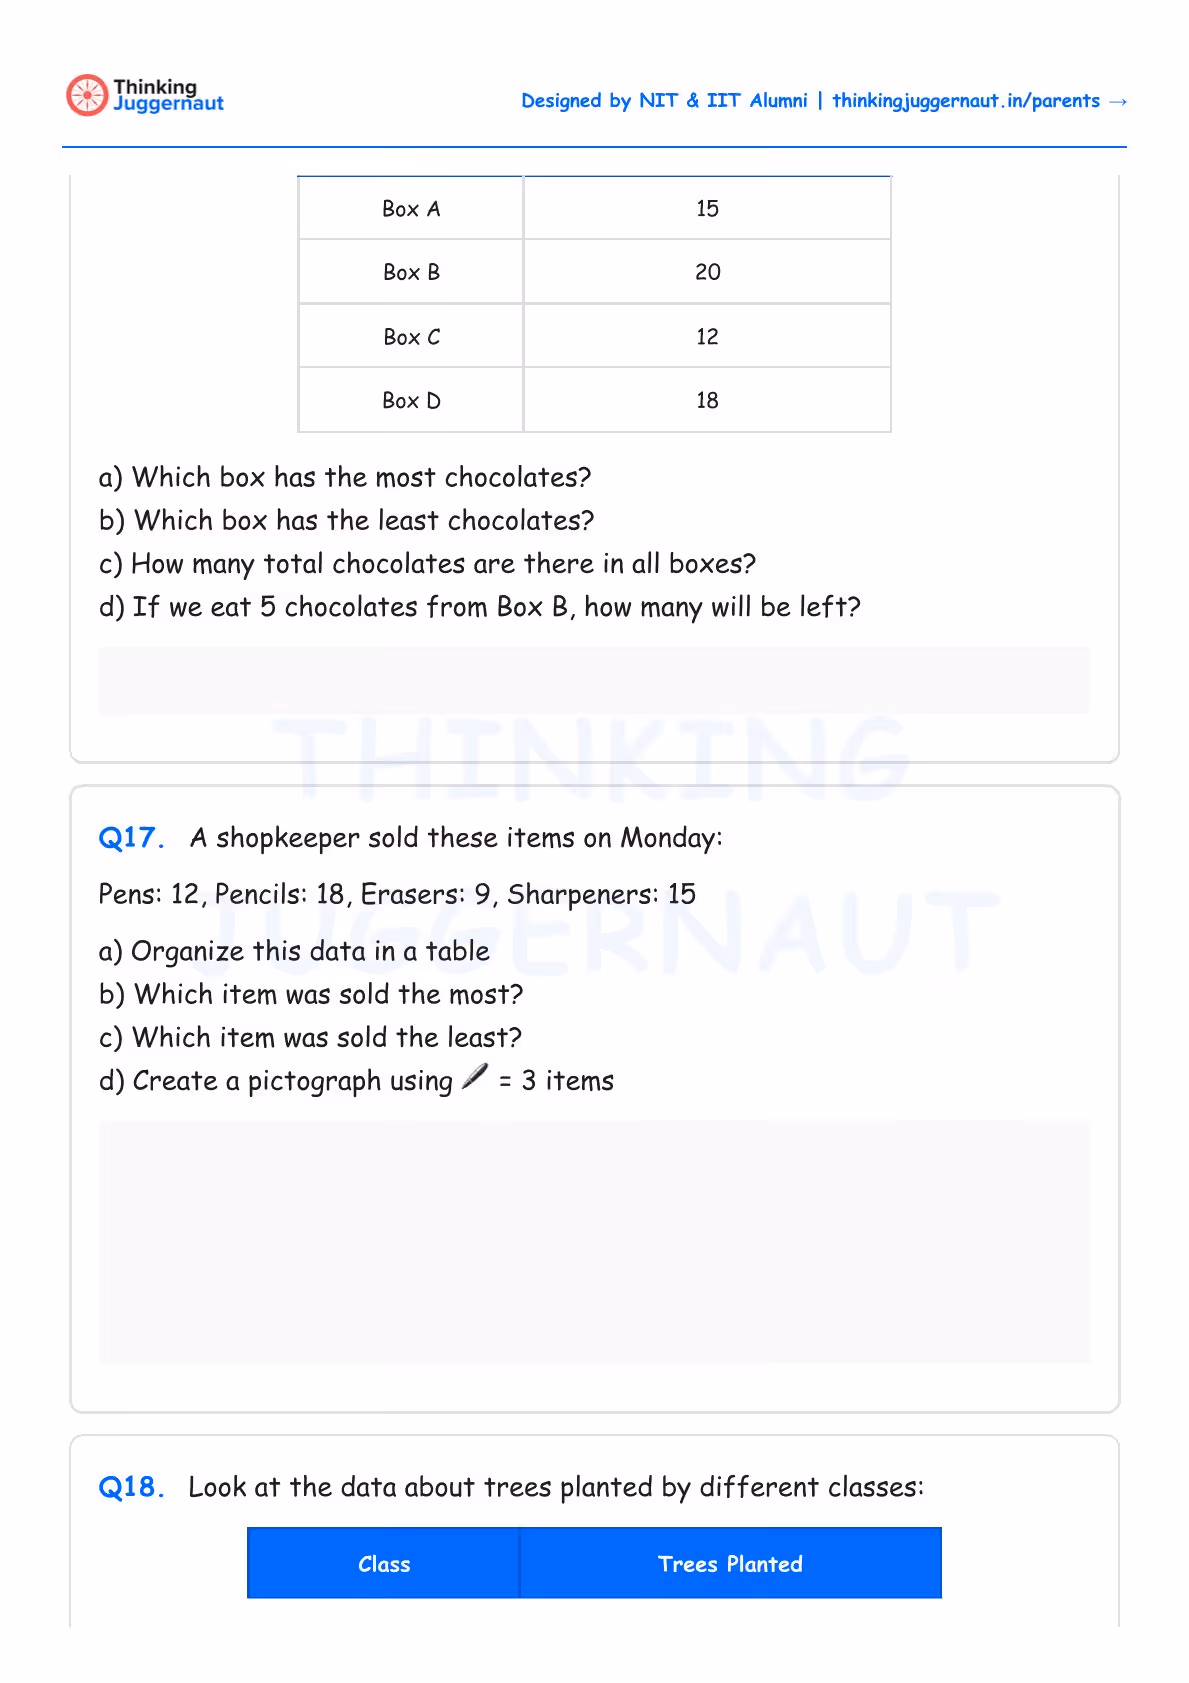
Tables: Organise data in rows and columns. Tables are the starting point before turning data into pictographs or graphs.
A pictograph shows books read by students. Each book symbol represents 2 books. Ananya has 3 symbols, Karan has 5, Meera has 2, and Vivek has 4.
Multiply the number of symbols by the scale value. Ananya read 3 × 2 = 6 books. Karan read 5 × 2 = 10 books. Meera read 2 × 2 = 4 books. Vivek read 4 × 2 = 8 books. Karan read the most. The total books read by everyone is 6 + 10 + 4 + 8 = 28.
Always check the key in a scaled pictograph before counting. Forgetting to multiply by the scale value is the most frequent error at this level.
When finding totals, add all categories together carefully. Skipping one item gives a wrong answer.
Read questions fully before starting. Many mistakes happen because students answer a different question than what was asked.
Practice drawing your own pictographs from tables. Turning data into a visual form helps you understand it better.
Count twice when working with large sets of mixed items. It is easy to miss one when sorting quickly.
Worksheets build practice. The Applied Maths Project Kit builds understanding — 30 real-world math activities covering the same concepts your child is practising here, from multiplication and grouping to measurement and data.
Designed by IIT & NIT Alumni · NEP-2020 aligned · Trusted by parents across India
Class 5 Decimals
Class 5 Fractions
Class 5 Percentage
Class 5 Basic Algebra
Class 5 Data Handling
Class 5 Geometry
Class 5 Ratio
Not in Class 5?
Visit our Main Math Worksheet Hub to explore all printable worksheets from Class 2 to Class 8.
Almost there!
We will confirm your order on WhatsApp
Order placed!
Thank you! You will receive a WhatsApp confirmation shortly.