⭐ Answer Key included!
Master data handling for Class 3 with our worksheet. Includes scaled pictographs, bar graphs, and data interpretation. Includes solved examples and practice questions to help your child analyse and compare real-world data.
Data Handling is the process of collecting, organising, and representing information so we can understand it better and make decisions. In Class 3, we move beyond simple counting. We learn to read scaled pictographs where one symbol represents more than one item, interpret bar graphs using a Y-axis scale, and analyse data to find patterns, totals, and differences.
Scaled Pictographs: One symbol now represents multiple items. For example, one apple symbol might equal 5 apples. Always check the key before counting.
Bar Graphs: Bars of different heights are read against a scale on the Y-axis to find exact values and compare quantities.
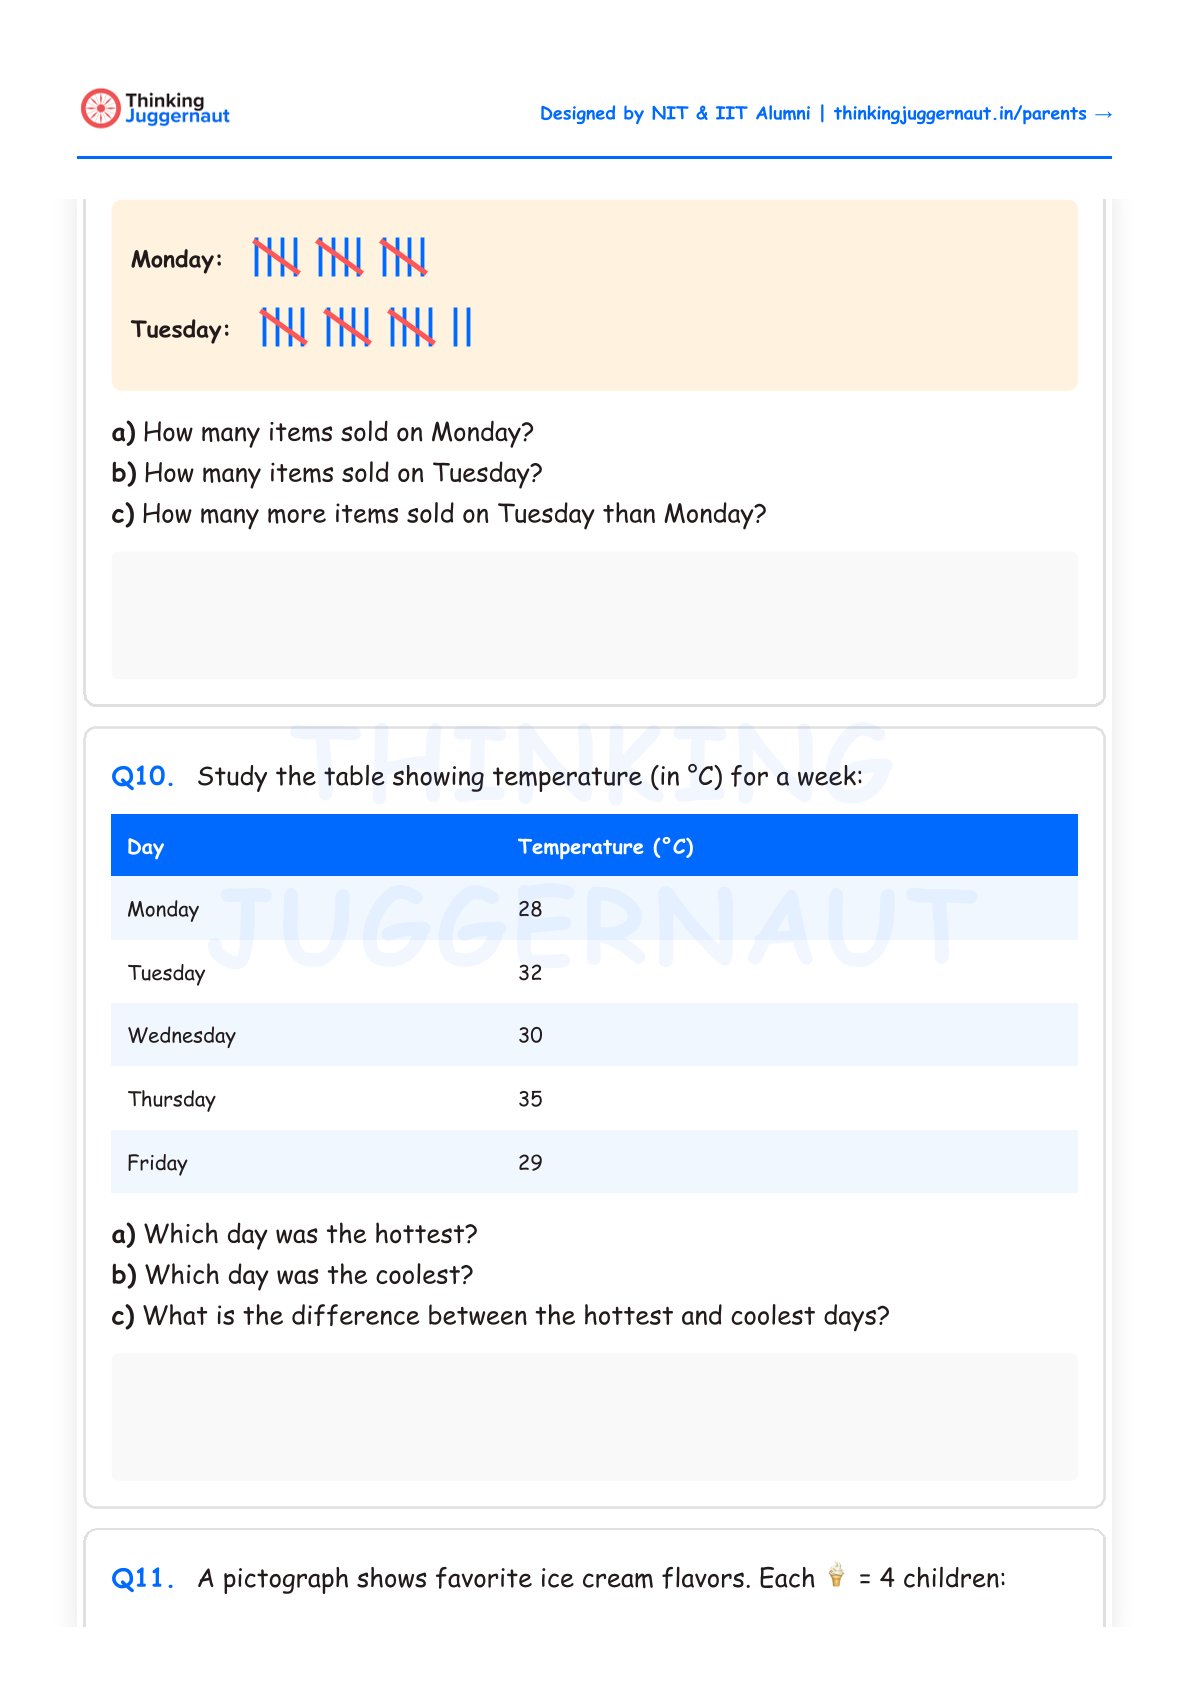
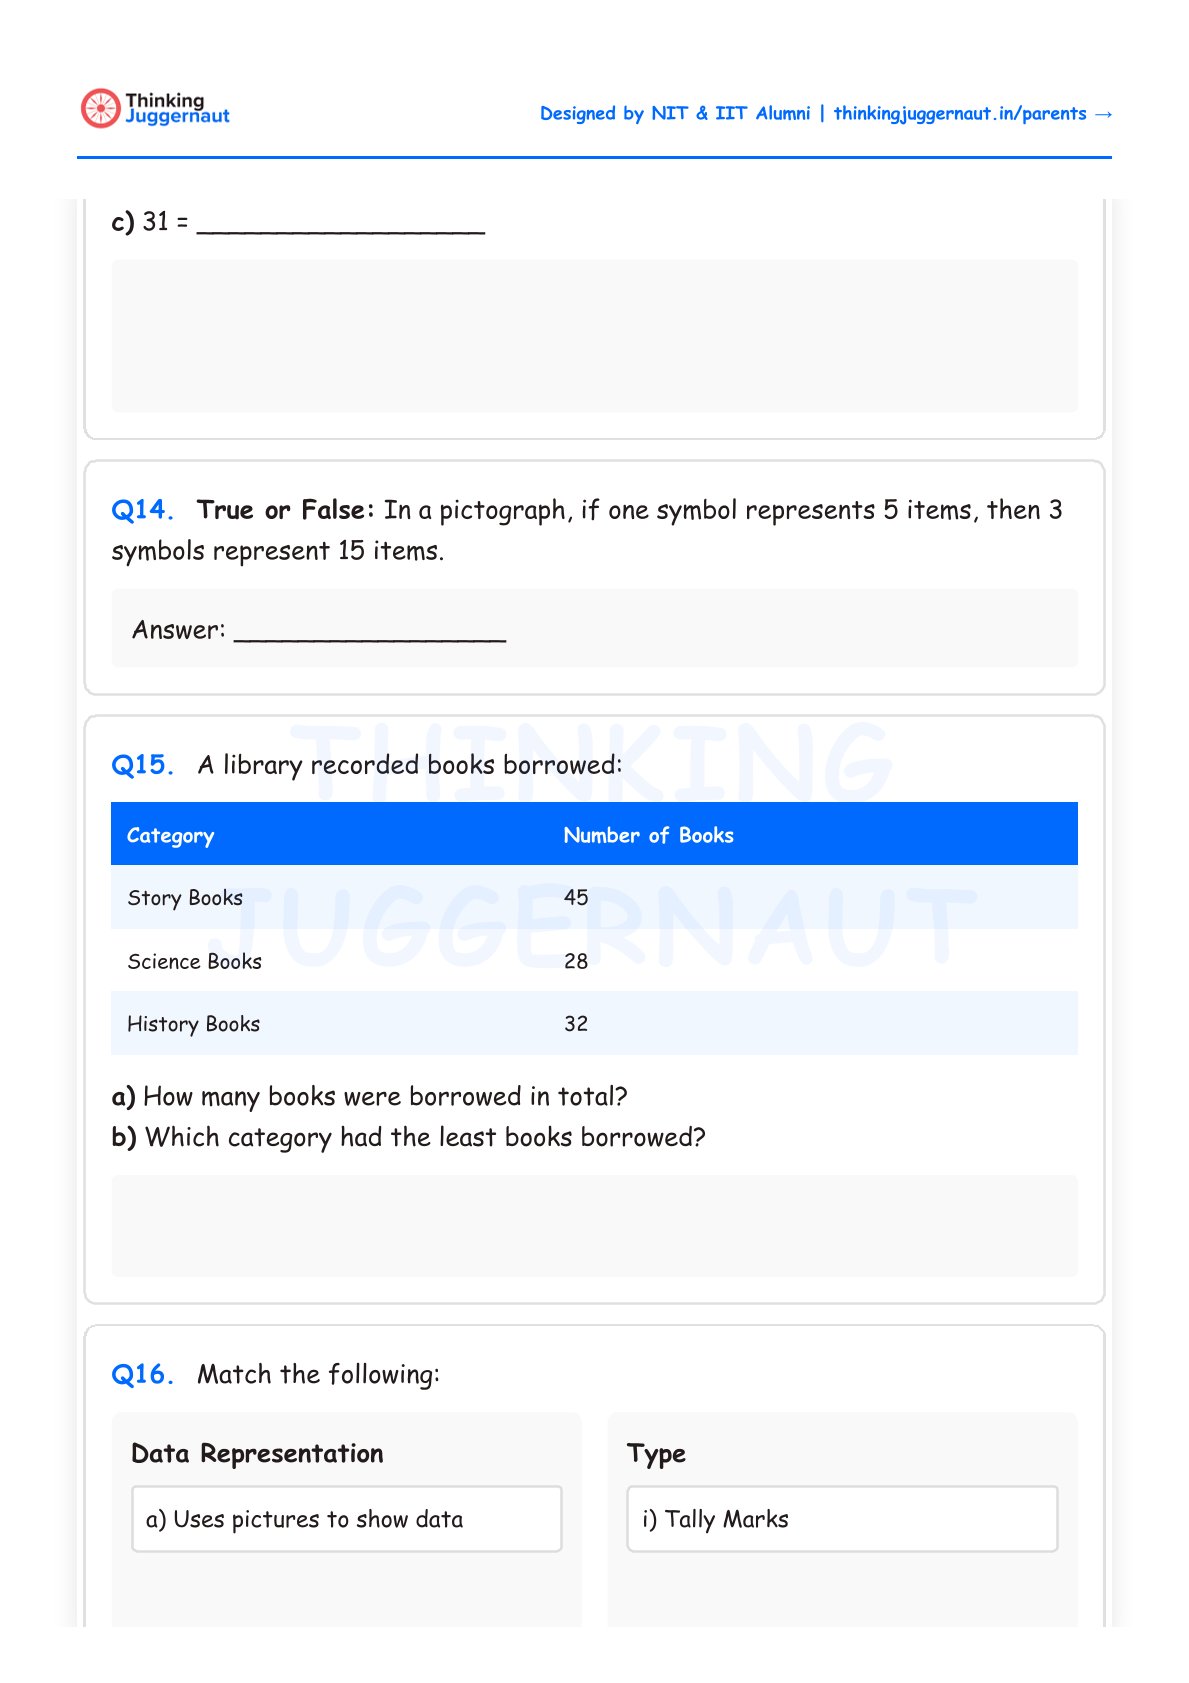
Data Interpretation: Reading data is not enough. We now ask deeper questions — which is the most, which is the least, what is the difference, and what is the total.
A school surveyed 50 students about their favourite sports. The bar graph shows: Cricket (18), Football (12), Badminton (15), Swimming (5).
First, check the Y-axis scale to understand what each unit represents. Then read the height of each bar to find the value. Cricket has the tallest bar at 18 students, making it the most popular. Swimming has the shortest bar at 5 students, making it the least popular. To find the total, add all values: 18 + 12 + 15 + 5 = 50. To find the difference between Cricket and Football: 18 − 12 = 6 students.
Always check the key – In scaled pictographs, one symbol can represent many items. Reading the key first prevents counting errors.
Master the Y-axis – Before reading a bar graph, understand what the scale represents. This is where most mistakes happen.
Think beyond counting – Class 3 data handling asks you to find totals, differences, and make comparisons. Practice these three operations with every graph or table you see.
Collect real data – Track something at home like daily screen time, meals eaten, or birds spotted. Organise it into a table, then turn it into a bar graph.
Use graph paper for accuracy – When drawing bar graphs, graph paper keeps bars neat and aligned to the scale.
Compare across categories – Practice spotting which value is the highest, which is the lowest, and which changed the most over time.
Class 3 Multiplication
Class 3 Multiplication Word Problems
Class 3 Division
Class 3 Division Word Problems
Class 3 Data Handling
Class 3 Fractions
Class 3 Geometry
Class 3 Word Problems
Not in Class 3?
Visit our Main Math Worksheet Hub to explore all printable worksheets from Class 2 to Class 8.